Information always improve knowledge. And there are multiple ways on internet such as infographics, blogs and through the social media websites are used to represent the information and data. With the help of these ways you can share your knowledge among internet users. Infogarphics is one of the best way to represent your visual representation of information and data.
With these graph given below are made with the help of multiple signs, words, maps and pictures to provide the best and creative Infographics. Infographics is easy to read and understand the data, information and knowledge.
In this collection of infographics, you can get different type of information represented in infographics designs such as social media , internet map of 2011, royal wedding, iPhone 5 rumor and many more you can get all knowledge from here.
So, here are 10 fresh infographics of year 2011. I hope you like these infographics and get knowledge from these visual graphs.
[re] [rss]
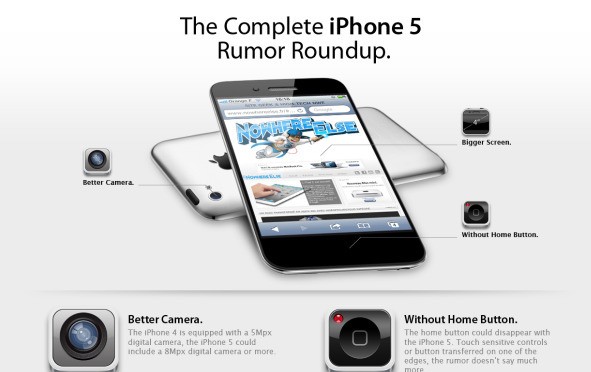
1) iPhone5
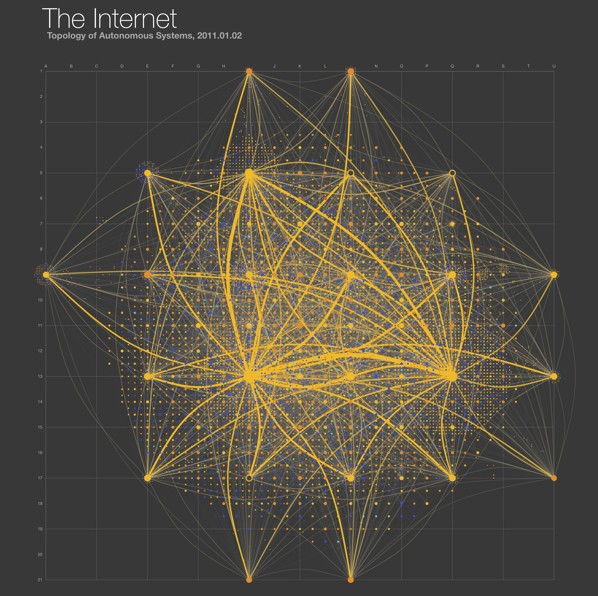
2) Map of the internet 2011
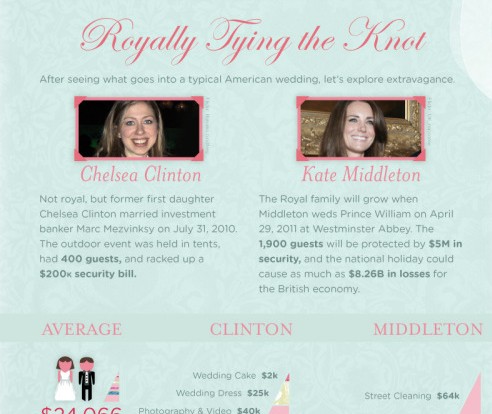
3) Regular vs Royal
4) The real cost of dating

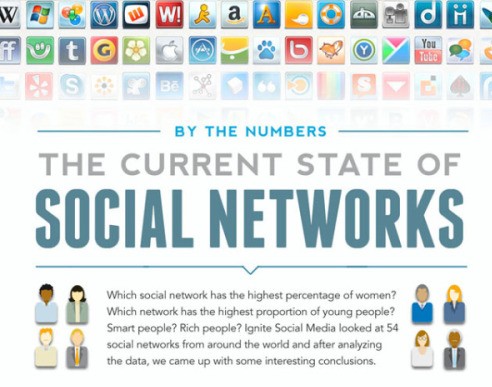
5) Social Networks Infographic
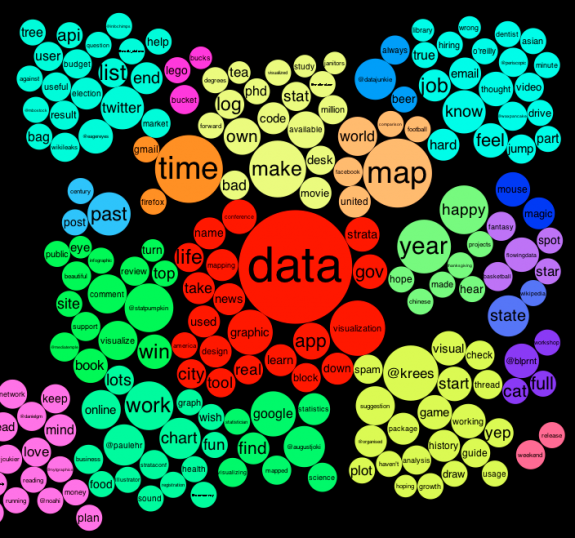
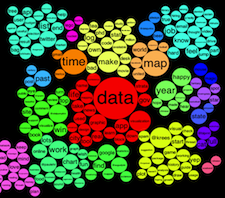
6) Tweet about with the topic explorer
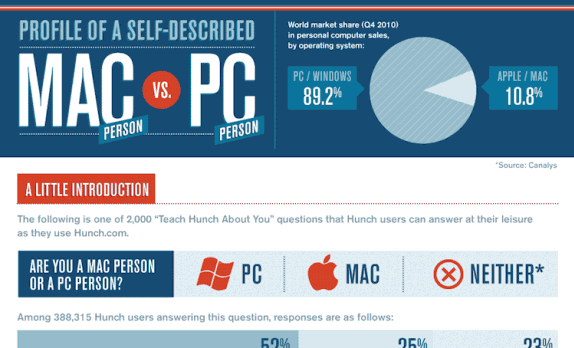
7) Mac vs PC People
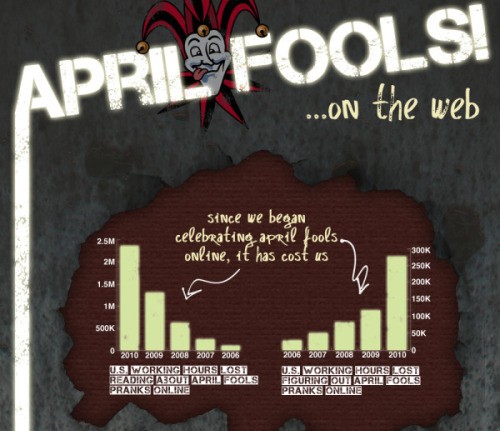
8 ) April Fools 2011
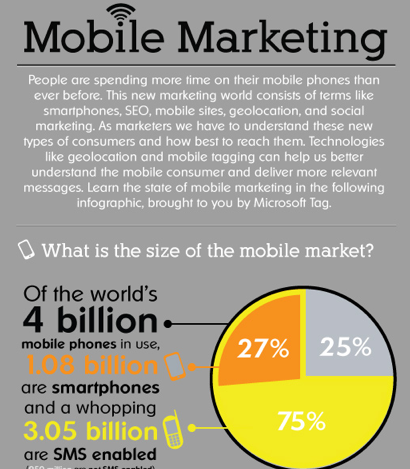
9) The Growth of Mobile Marketing
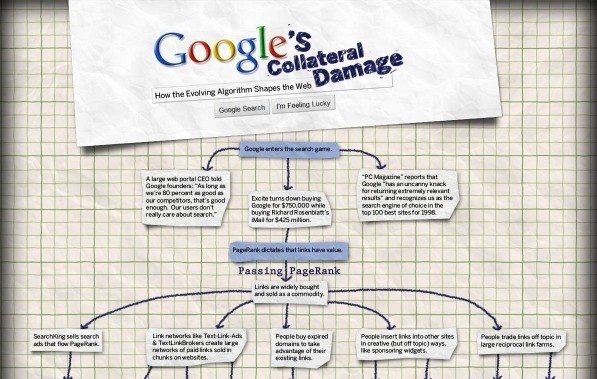
10) Collateral Damage
Pingback: OTR Links for 05/06/2011 « doug – off the record
I heard iphone 5 will have a hologram features. It even has a holographic keyboard so it will be more convenient for the users to type their message.