Information always improve knowledge. And there are multiple ways on internet such as infographics, blogs and through the social media websites are used to represent the information and data. With the help of these ways you can share your knowledge among internet users. Infogarphics is one of the best way to represent your visual representation of information and data.
With these graph given below are made with the help of multiple signs, words, maps and pictures to provide the best and creative Infographics. Infographics is easy to read and understand the data, information and knowledge.
In this collection of infographics, you can get different type of information represented in infographics designs such as social media , internet boom, politics parties related you can get all knowledge from here.
So, here are 10 informative infographics to improve your knowledge. I hope you like these infographic and get knowledge from these visual graphs.
[re] [rss] [ad1]
1) What is Data Visualization

2) Look At Facebook and Twitter

3) The Present and Future Music

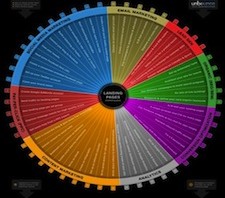
4) The Noob Guide to Online Marketing

5) The Infographic History Of sxsw

6) Apples to Oranges

7) 2011 Salary Survey For SAP

8 ) History Of Politics parties

9) Anatomy of an Apple Email

10) Soft Drink Industry Structure

Very Informative thanks for share….
Pingback: 10 Informative Infographics To Improve Your Knowledge | Share Blog
Pingback: 10 Informative Infographics To Improve Your Knowledge | WebDevKungfu
Nice Stuff! Very Inspirational. #’s 2, 5, 7 & 1o are my favorites. Will take advantage!
Thanks
Pingback: InfoGraphic: “Guida al marketing online per principianti” « Giacomo Ratta
Pingback: Bibliotheken en het Digitale Leven in Maart 2011 | Dee'tjes
What a nice stuff guys!! A truly inspiring piece for graphic designers as well.
facebook is boss of all sites
Pingback: Is it true? – Understanding infographics | GannettLocal Blog
love the humor you presented in infographics!!! Question Authority!